I believe that digital marketer and Web Analyst know ObservePoint.
For those who don’t know, It is software to help companies ensure digital analytics data is accurate and actionable. We accomplish this by scanning websites and apps to make sure analytics tags are present and collecting data as expected. Another term for this is “tag governance” (more on this topic in a following section).
But that’s just the tip of the iceberg. A drop in the ocean. A single grain of sand on Pebble Beach. Essentially, in the act of scanning your website, ObservePoint can test nearly any hitch, joint or hinge holding your website together. And we can do it at scale.
Observe Point is very excited for the user to experience the transformative update based on user’s feedback!
We love the new UI with it’s light & dark mode, account-wide reporting, and deeper insights. As you explore the new ObservePoint experience, we’d love to hear your reactions. Included in this link are the full release notes.
Aggregate Reporting
The Account Wide Dashboard is the first dashboard you see on the site it will give you insights from across your account’s audits. There are a number of features that go along with this dashboard and the others in the ObservePoint app. Across the top, you’ll see some specific data related to the audits in your account.

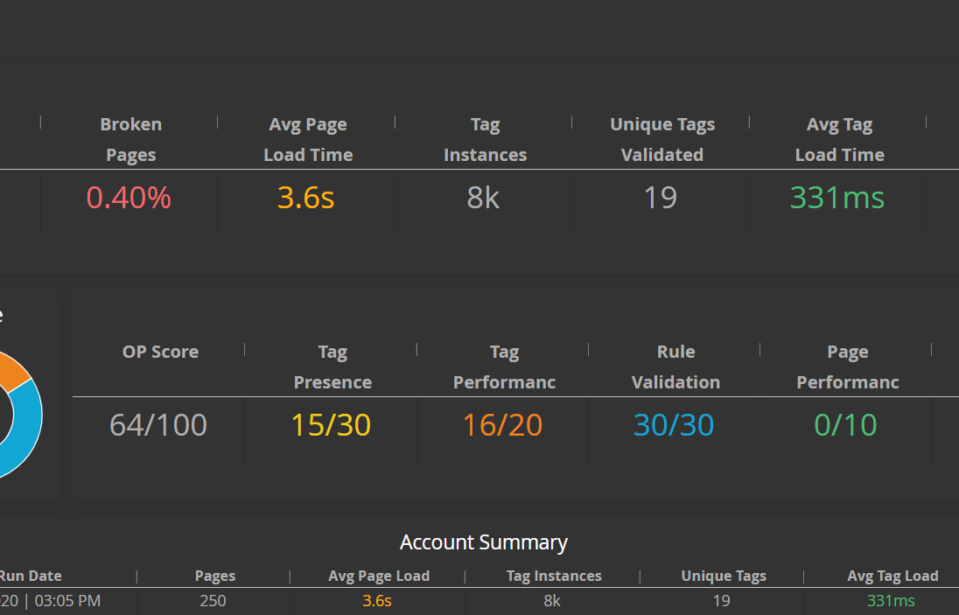
Along the top of the dashboard you’ll find some stats pulled from your audits. These can give you quick insight into the number of pages scanned, any broken pages, average page load time is, tags that were found, broken tags, and average tag load time. You’ll also see a breakdown of the average OP Score across your audits:
 This score is broken down into five criteria as follows:
- Tag Presence – 30 points possible based on the consistency of Primary Tag presence across the audit.
- Rules – 30 points possible and based on the pass/fail rate of applied user rules.
- Tag Performance – 20 points possible, any Primary Tag loading over 400ms will deduct from the score.
- Page Performance – 10 Points possible, with 3 seconds being the benchmark.
- Cookies – 10 points possible, cookies without a defined same-site attribute and non-secure cookies will deduct from this score.
Filters
 You can filter all dashboards in ObservePoint along the top. There are a number of options to filter by! Currently, you can only filter audits into the dashboard, but look for upcoming options within your filters and new filters to be added! Outside of filtering which audits you see you can also filter which tags are contributing to your insights by using the Tag Filtering toggle. This shows insights only related to your primary tags. So if it’s Tag Presence and your Tag Filtering is on, that means the ‘Tag Presence’ rating is only based on your primary tags being present not on other tags on the site. You can adjust your primary tags by going to the Tag Setup under configurations.
Sharing Features

There are new options for sharing these great insights with your team and beyond. By clicking on the three-dot icon in the top right of the dashboard you can access the above menu and either download the information or schedule a delivery. If for instance, a member of your team or another wanted to get a monthly export of this dashboard you could send them a pdf version at the beginning of each month. This will provide you with an easy to share snapshot for anyone interested in the insights you’re gaining! You can share this dashboard as well as from the other insight focused dashboards with just a click of a button!
Technology Dashboard
Tagging Insights from Across Your Account
The Technology dashboard aggregates tag-related insights from across your data sources. Just like the Account-wide Dashboard you can use filters to manage this information and share it as a .pdf or .csv file as needed by using the three dots in the top right. The insights offered by the Technology dashboard are focused on many of the insights you previously gained from audits but in an aggregated view.
In addition to the insights, you’ll see a tag inventory and some related stats. Again filtering will apply, especially the Tag Filtering when toggled which narrows the scope to just the tags that interest you.

Other Reports
You will also get access to some of your audit reports but now at an account-wide level. You can filter these reports just like any of the other dashboards. This all falls under the Technology section of the platform!

Tag Inventory
The Pages with Tags is a completely revamped version of the old Tag Presence report. Tag Categories have been introduced giving you a breakdown of what types of tags you have on your pages. The presence of tags, the number of tag accounts, pages and percentages where they are found are highlighted as well. A new insight is the number of tags per page and the percentage of tags found on each page as well. This report has several drill downs that give you the ability to explore what a tag is loading and how a tag is performing.

You’ll be able to quickly assess the tagging ecosystem across your site by looking at this report and identify any rogue or piggybacking tags that may have appeared. Make sure to keep an eye on the tags on your site and focus on tag governance. Know who each tag owner is and what their expectations are for tagging across the site. That way you can send them insights on their tags and keep things running smooth!
Tag Load Time
This report highlights tags that are loading at different speed thresholds. You can take a deeper look at any technology through the report drill downs. You can now even see how that tag has loaded over time.

You can see the breakdown of tag load thresholds with your slower tags highlighted in red to be addressed. This is a great insight to share with your team as you work to improve page performance and also a great marker for success as you move tags into the green!
Tag Versions
Deeper insight is now found for what version of code is being used across tag technologies, including the number of unique versions and what the implementation rate is across pages scanned for each tag and version.

Duplicates & Multiples
Tags that fire duplicate requests and multiple requests have now been combined into one report. You can quickly see tags that had the most requests and across how many pages. Just like the old Duplicates & Multiples reports, Duplicates means a tag has fired more than once on a page with the exact same information, aside from social tags this behavior is usually not normal and could inflate your analytics.
Multiples are tags that fire multiple times on the page but with different data, this is more common behavior but worth investigating if you are having page performance issues. Prevent data inflation by keeping on top of this report and keeping your tag vendors accountable!

Tag Status Codes
Your tag may have loaded, but did that data make it back to the collection servers? In this report you can pinpoint broken requests or if tags were redirected. You also have some quick drill downs to capture more insights about a specific tag and page combination.
This is a quick way to gauge if any tags are in trouble, what tags you still need to transition from redirects and which tags are looking good!
Cookie Inventory
This report will give you an inventory of which cookies are set across your data sources, their attributes like 1st or 3rd party, secure or non-secure, same-site, etc.

Quickly identify where you might be losing data due to new regulations and changes in browsers like Chrome & Safari!
Page Inventory & Detail
This report now combines which pages were scanned, their HTTP status codes, and page load times. Making it easy to digest all page level information in one view. Quickly spot any problems with any of your specific pages. For any of the pages you can also dive into the Tag Initiators report which shows how tags are initiated across the site, which tags are on the page, network requests, console logs, and cookies.
These little buttons next to your URLs drill into those page specific details:

Standards, Configurations & Data Sources
Standards
Standards is where Rules and Consent Preferences are configured. All rules that you have previously created will be available in the new UI. Consent Preferences are a part of the Privacy product offering and are explained here.
Configurations
Configurations is where you can find additional test setup tools including:
- Action Sets
- Remote File Mapping
- Comparisons
- Tag Setup (Define Primary Tags & Comparisons match criteria)
- Bulk Actions (Manage Folders, Domains, & Labels)
Data Sources
This is where the My Cards view lives. All of your Audits, Web Journeys, App Journeys, LiveConnect Sessions & Har File Uploads will live here!
Create New
There’s a new create button in your UI as well! This will allow you to create a wider range of ObservePoint data sources from one simple spot!
New UI for Account & User Tools
Dark/Light Mode Toggle
With this toggle you can switch from Dark Mode to Light or back again!

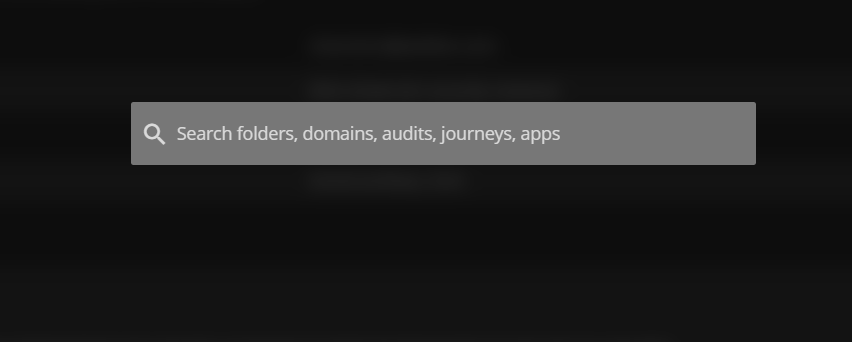
Search
This allows you to search folders, domains, audits, journeys and apps for what you are looking for within the platform!

Support
Here you can find help for all of your support needs, including:
- Customer Support chat/email
- Help Documentation (suggests articles based on the page you are looking at)
- Academy Training (tutorials for onboarding/training new users)
- Tag Database (verify that the technologies you need are available in our database)
- Feedback Portal (submit new ideas and vote up existing/planned ones)
- API Documentation
- Script Services Submission Form (if you have Script Services in your contract, submit requests here)

Settings
Here you can manage users, monitor usage across the lifetime of the account, and check the Event Log for updates/changes made to configurations.
 Profile
Under your own name in the bottom left is your profile you can quickly change settings or grab your API key.

At last there is Search option too which most of the good product have.
Enjoy the new experience and comment your thought below!

Leave a comment
[wpqa_login]