
What is HAR file?
The HAR file format is an evolving standard and the information contained within it is both flexible and extensible. You can expect a HAR file to include a breakdown of timings including:
- How long it takes to fetch DNS information
- How long each object takes to be requested
- How long it takes to connect to the server
- How long it takes to transfer assets from the server to the browser of each object
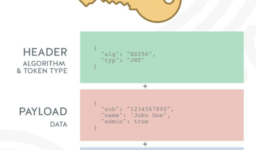
The data is stored as a JSON document and extracting meaning from the low-level data is not always easy. But with practice a HAR file can quickly help you identify the key performance problems with a web page, letting you efficiently target your development efforts at areas of your site that will deliver the greatest results.
How to get a HAR file
As HAR files are still an evolving format, support can be patchy and it may take some work to get your HAR file. High quality monitoring services will collect the HAR data for each sample they take. Automated testing tools can be tailored to get HAR files.
It is possible to use Firefox, Firebug, and NetExport together to generate a HAR file for a specific URL. That said, if you are using a modern browser it can generate a waterfall diagram, without the need to capture the HAR file as an interim representation, and this provides most of the information you will need in an instantly available view.
How to generate a HAR file in Chrome
- Start by opening Google Chrome. If you do not have Google Chrome and you are free to install additional programs, please download Google Chrome and install it.
- In Chrome, go to the page within Box where you are experiencing trouble
- Select the Chrome menu (⋮) at the top-right of your browser window, then select Tools > Developer Tools.
- The Developer Tools will open as a docked panel at the side or bottom of Chrome. Click on the Network tab.
- Select the option Preserve log
- The recording should autostart and you will see a red circle at the top left of the Network tab. If not, click the black circle, to start recording activity in your browser.
- Refresh the Box page you are on. The goal is to reproduce the problem you’ve been experiencing while Google Chrome is recording activity.
- Once you’ve encountered the problem successfully while recording, right-click within the Network tab and click Save as HAR with Content to save a copy of the activity that you recorded.
- Save the HAR file somewhere convenient.
- Now click the Console tab and right-click anywhere in the console log. Select the popup option “Save as…” and name the log file: Chrome-console.log
- Close the developer panel and you’re done! Please attach the HAR file and the Chrome-console.log to your email share it with the IT person to use it for troubleshooting.
Visualizing a HAR file
As the file is in a JSON format, this is relatively easy to process with software, but it can be difficult for us humans to visualize. Here are three options that will create visualizations of HAR files:
- softwareishard.com. With this site you can simply paste your HAR File into the field and it will generate a report.
- Your monitoring service. This should provide a visualization of your page loads for each sample they take. Compare your load times from different geographic locations to get a broader view of your customers’ experience.
- Developer tools for browsers. I developed my first pass of web pages in Chrome. The Network Tab of the developer tools shows the webpage waterfall. Its easy availability makes it a great tool to work with.
Additional information is that yslow can be run from the command line and given a HAR file. You can include this as part of your automated regression testing to ensure your most recent changes are not degrading the behavior of your website.

Leave a comment
[wpqa_login]