Once a potential visitor clicks on a link that will take them to your website, Google Analytics starts tracking seven specific metrics that measure system performance.
The following is the order in which these measurements occur or the timeline in which Google measures metrics associated with system performance and determines the Average Page Load Time.
• Average Redirection Time (The target range for this measure should be between 0 and 0.30 seconds.) – Redirects should be avoided but sometimes they are inevitable and if redirects are involved this will indicate the time it takes for a redirect to start and end, if no redirects are involved this metric will show zero (0).
• Average Domain Lookup Time (Target range for this measure is between 0.01 and 0.03 seconds.) – Google defines this as “the average amount of time (in seconds) spent in DNS lookup for this page.” This measures how long the user’s browser searches for your website’s IP address. At this point in the timeline, no data from your website has started to load and a common factor that can affect this measurement is content being rendered from multiple locations (i.e., Third party scripts.) This should be one of the shortest time measurements associated with the page load timing sequence.
• Average Server Connection Time (Target range for this measure is between 0.01 and 0.25 seconds.) – Google defines this as “the average amount of time (in seconds) spent in establishing a TCP connection for this page.” This timer starts immediately after the domain lookup is complete and measures the amount of time it takes for the server to connect with your visitor’s device. This measure, much like Average Domain Lookup Time, should also be one of the two fastest times in the timeline for a page to load.
• Average Server Response Time (ART) (The target range for this measure should be 0.20 seconds (200ms) or less.) – Google defines this as “the average amount of time (in seconds) your server takes to respond to a user request, including the network time from user’s location to your server.” This metric can be affected by any or all of the following: slow application logic, slow database queries, slow routing, and resources issues such as CPU starvation, memory starvation, even the visitor’s location and network architecture.
• Average Document Interactive Time (Target range for this measure is less than 0.80 seconds.) – This measurement starts when actual page content begins to load into the visitor’s browser. During the document interactive time, the page is still loading but enough content is loaded that the visitor can begin to engage with the page. The user can likely see text, click on a hyperlink, and see an image or two. This metric measures the amount of time in seconds it takes to get to this point in the timeline from the initiation of the timeline (items 1 – 4 above.) While content is not fully loaded, it is at this point that most visitors will perceive that a page either loads fast or slow.
• Average Document Content Loaded Time (Target range for this measure should be less than 1.0 second.) – Google defines this metric as “the average time (in seconds) that the browser takes to parse the document and execute deferred and parser-inserted scripts (Document Object Model (DOM) Content Loaded), including the network time from the user’s location to your server.” This measure takes into account the entire timeline up to this point (items 1 – 5) and as such it should always be higher than the Average Document Interactive Time.
• Average Page Download Time (The target range for this measure is 1.0 second or less.) – Google defines this measurement as “the average amount of time (in seconds) to download this page.” At this point, the web page has finished loading but other aspects such as CSS, images, and any other items referenced have not fully loaded, this measurement quits counting once all content has loaded. This measure does not include any other measures up to this point, only the time for the entire web page content to be loaded to completion.
var loadTime = window.performance.timing.domContentLoadedEventEnd- window.performance.timing.navigationStart;console.log(window.performance);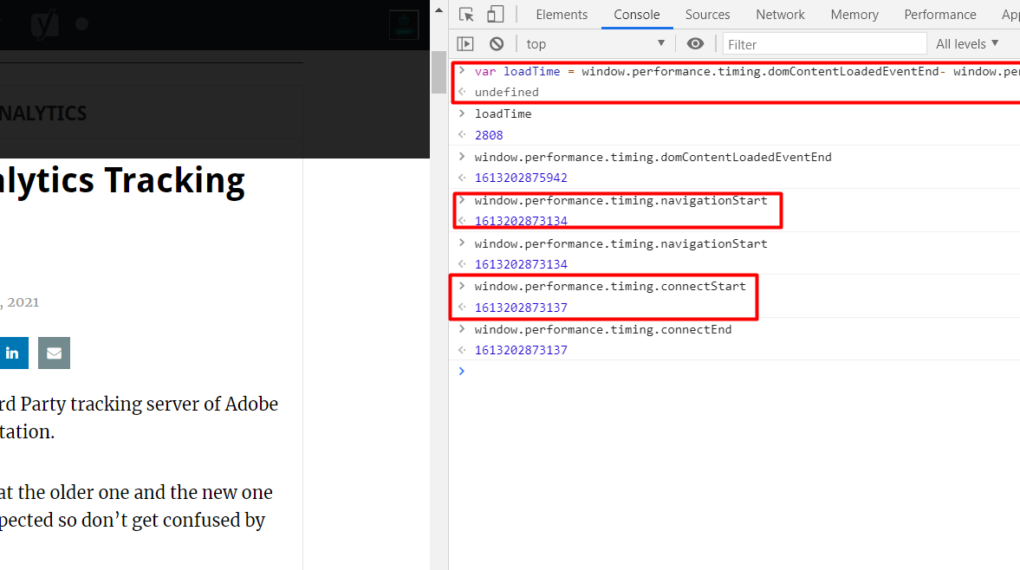
- connectEnd : Time when server connection is finished.
- connectStart : Time just before server connection begins.
- domComplete : Time just before document readiness completes.
- domContentLoadedEventEnd : Time after DOMContentLoaded event completes.
- domContentLoadedEventStart : Time just before DOMContentLoaded starts.
- domInteractive : Time just before readiness set to interactive.
- domLoading : Time just before readiness set to loading.
- domainLookupEnd : Time after domain name lookup.
- domainLookupStart : Time just before domain name lookup.
- fetchStart : Time when the resource starts being fetched.
- loadEventEnd : Time when the load event is complete.
- loadEventStart : Time just before the load event is fired.
- navigationStart : Time after the previous document begins unload.
- redirectCount : Number of redirects since the last non-redirect.
- redirectEnd : Time after last redirect response ends.
- redirectStart : Time of fetch that initiated a redirect.
- requestStart : Time just before a server request.
- responseEnd : Time after the end of a response or connection.
- responseStart : Time just before the start of a response.
- timing : Reference to a performance timing object.
- navigation : Reference to performance navigation object.
- performance : Reference to performance object for a window.
- type : Type of the last non-redirect navigation event.
- unloadEventEnd : Time after the previous document is unloaded.
- unloadEventStart : Time just before the unload event is fired.
You can capture these values in Adobe Analytics variable and repurpose that as per your use case.
Note: A single-page application works in the browser and requires no page reloads and no extra time for waiting. The page doesn’t need to be updated since content is downloaded automatically and DOM not generated only once in SPA . So page load time is also generated for only one time.

Leave a comment
[wpqa_login]